Get the most out of your data with ExoClick’s customizable dashboards
Data analytics is a priceless tool for both Publishers and Advertisers, helping them better understand their market in order to create an overall picture of what is happening with their customers and business, and, ultimately, maximize profit: With the right insights, Publishers can create direct connections with end users and Advertiser ads that have been tailored to reach the right audiences – Which are carefully targeted by the latter, thanks to being able to make quick data-driven decisions guided by the right insights. To help you get the most out of your data with ExoClick’s dashboards in the Admin Panel, we will tell you how to view, set up and customize dashboards, and we will also provide Publisher and Advertiser examples of how ExoClick’s clients use their custom dashboards in order to help you create your own ones using the most relevant and bespoke data for your business. Read on!
How to visualize data in your ExoClick Admin Panel
When you want to visualize data in your ExoClick Admin Panel, you just need to log into your ExoClick account. Then you will see the ‘Graph Data’ panel at the top of the screen that shows you charts of campaign data or traffic statistics, while the ‘Table Data’ panel at the bottom displays tables of recent relevant data.
If you look at the top of the dashboard view you will see two buttons for creating a ‘New Dashboard’ and a ‘New Widget’. When you click on ‘New Dashboard’ a new dashboard will be created and you can start customizing it with the data and widgets you want. For instance, you can create specific dashboards for your selected GEOs, devices and browsers.

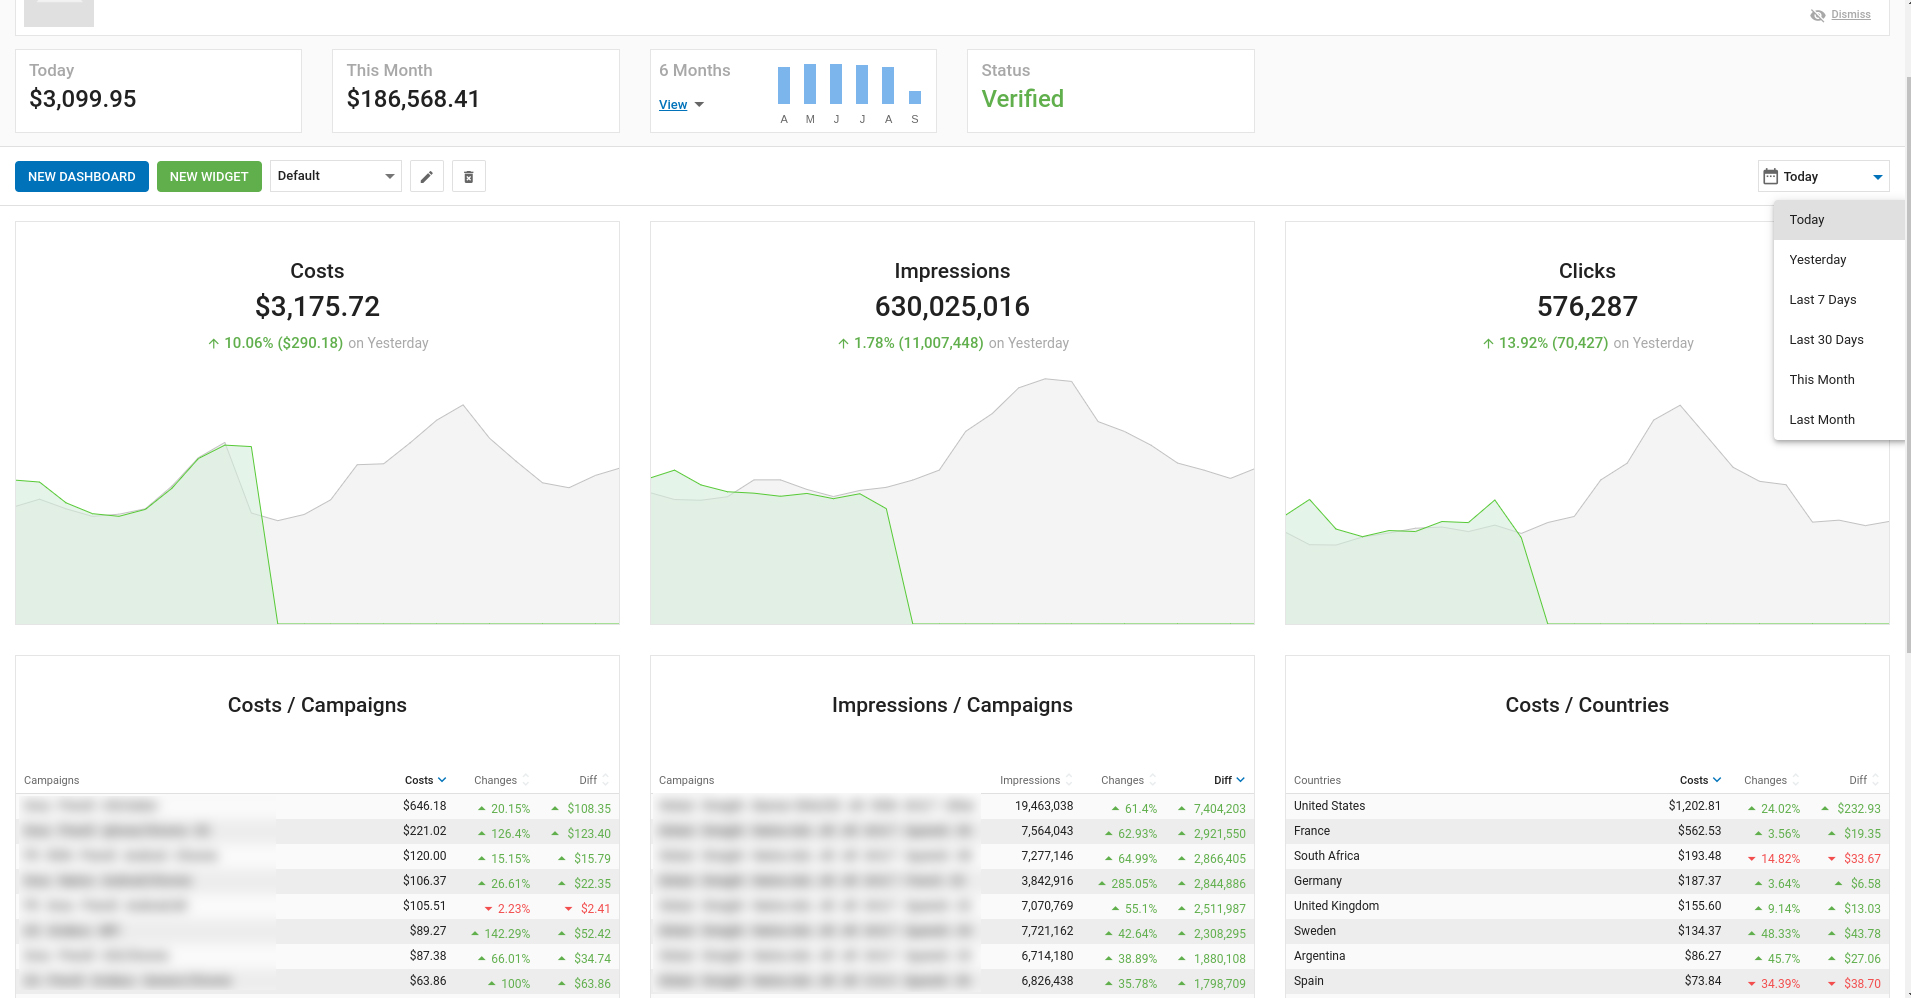
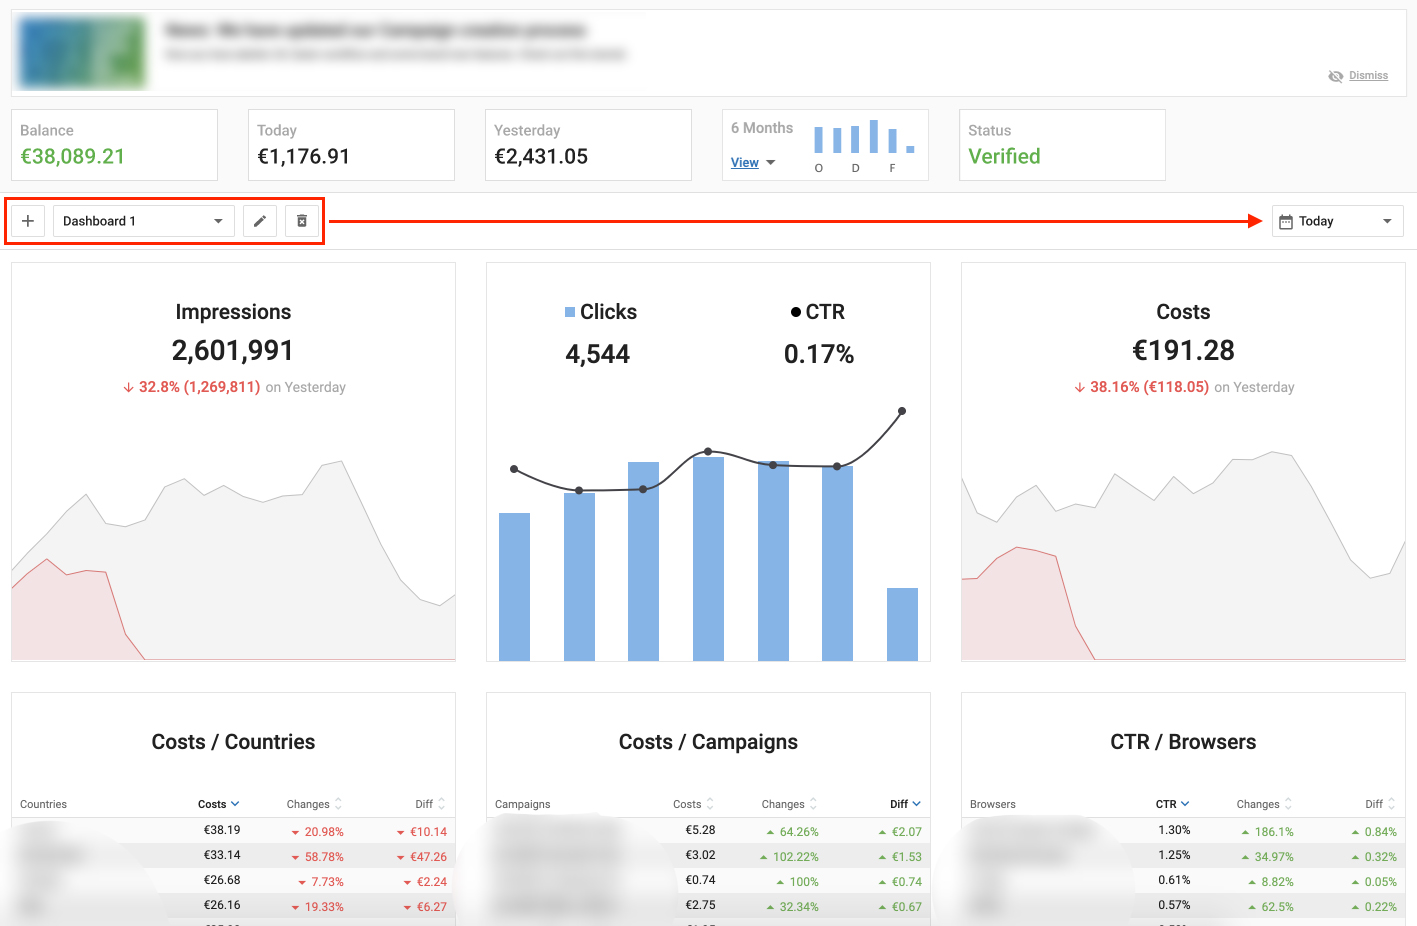
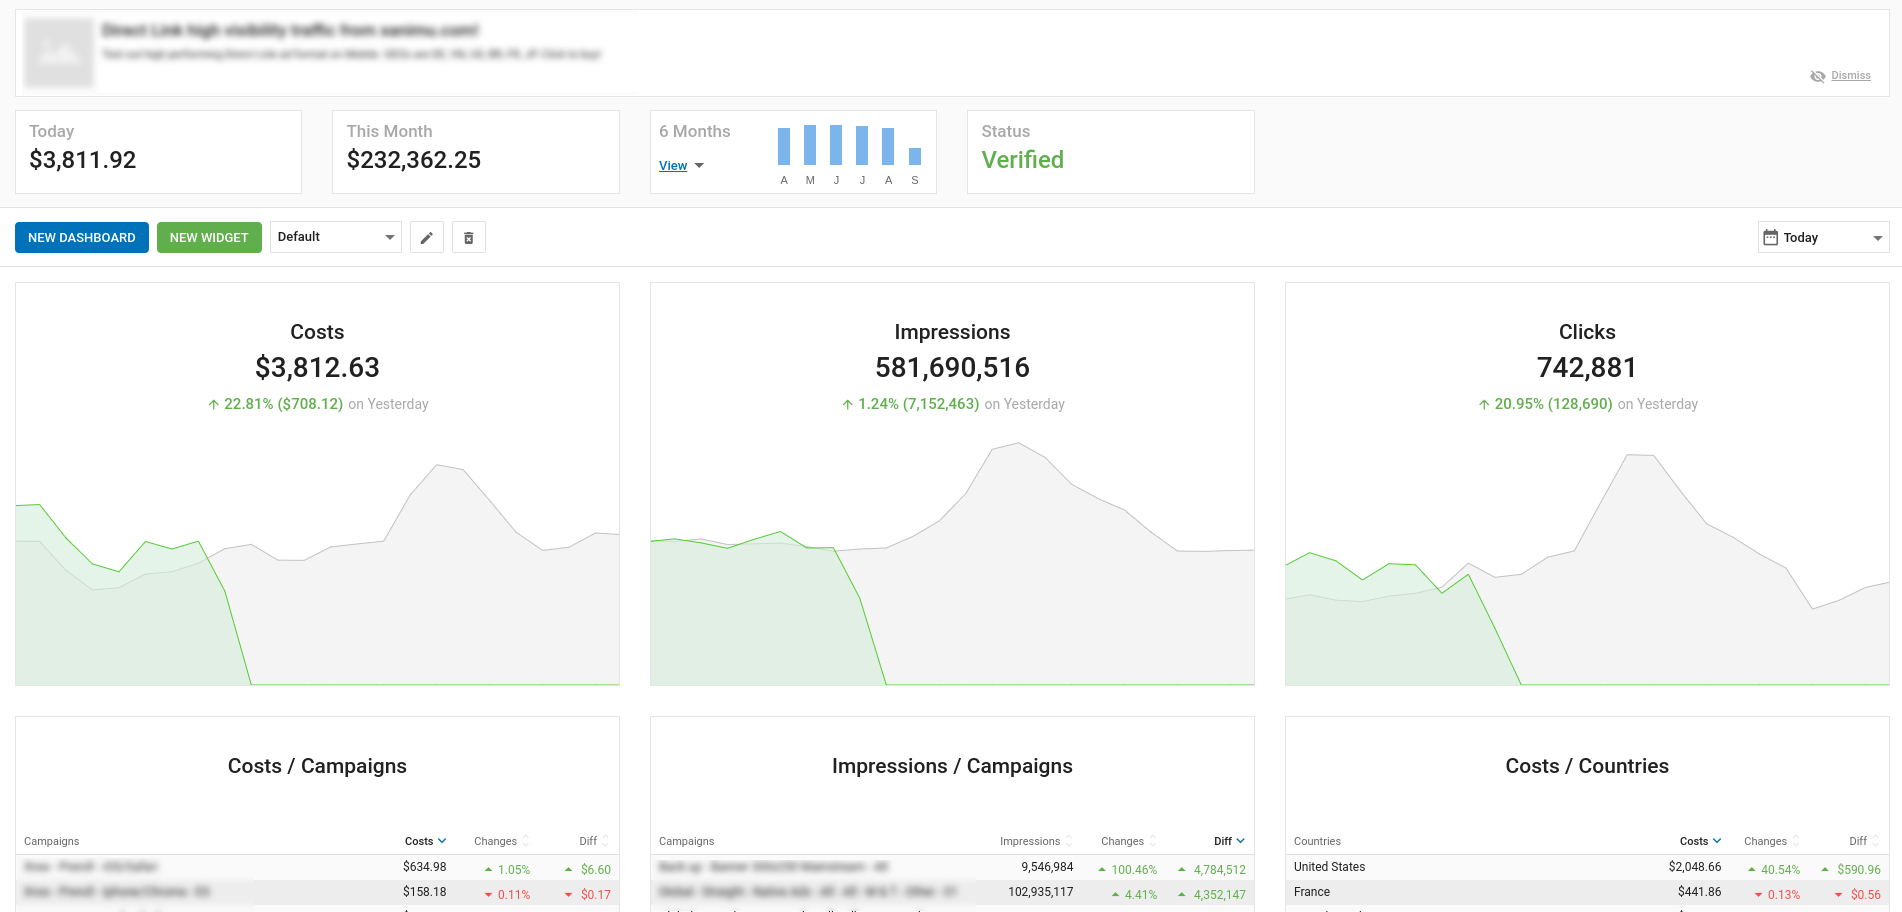
See an example of a dashboard view below. The ‘Costs’, ‘Impressions’ & ‘Clicks’ widgets are included by default. However, by using the cursor you can change the position of any widget by dragging and dropping them from one place to another.
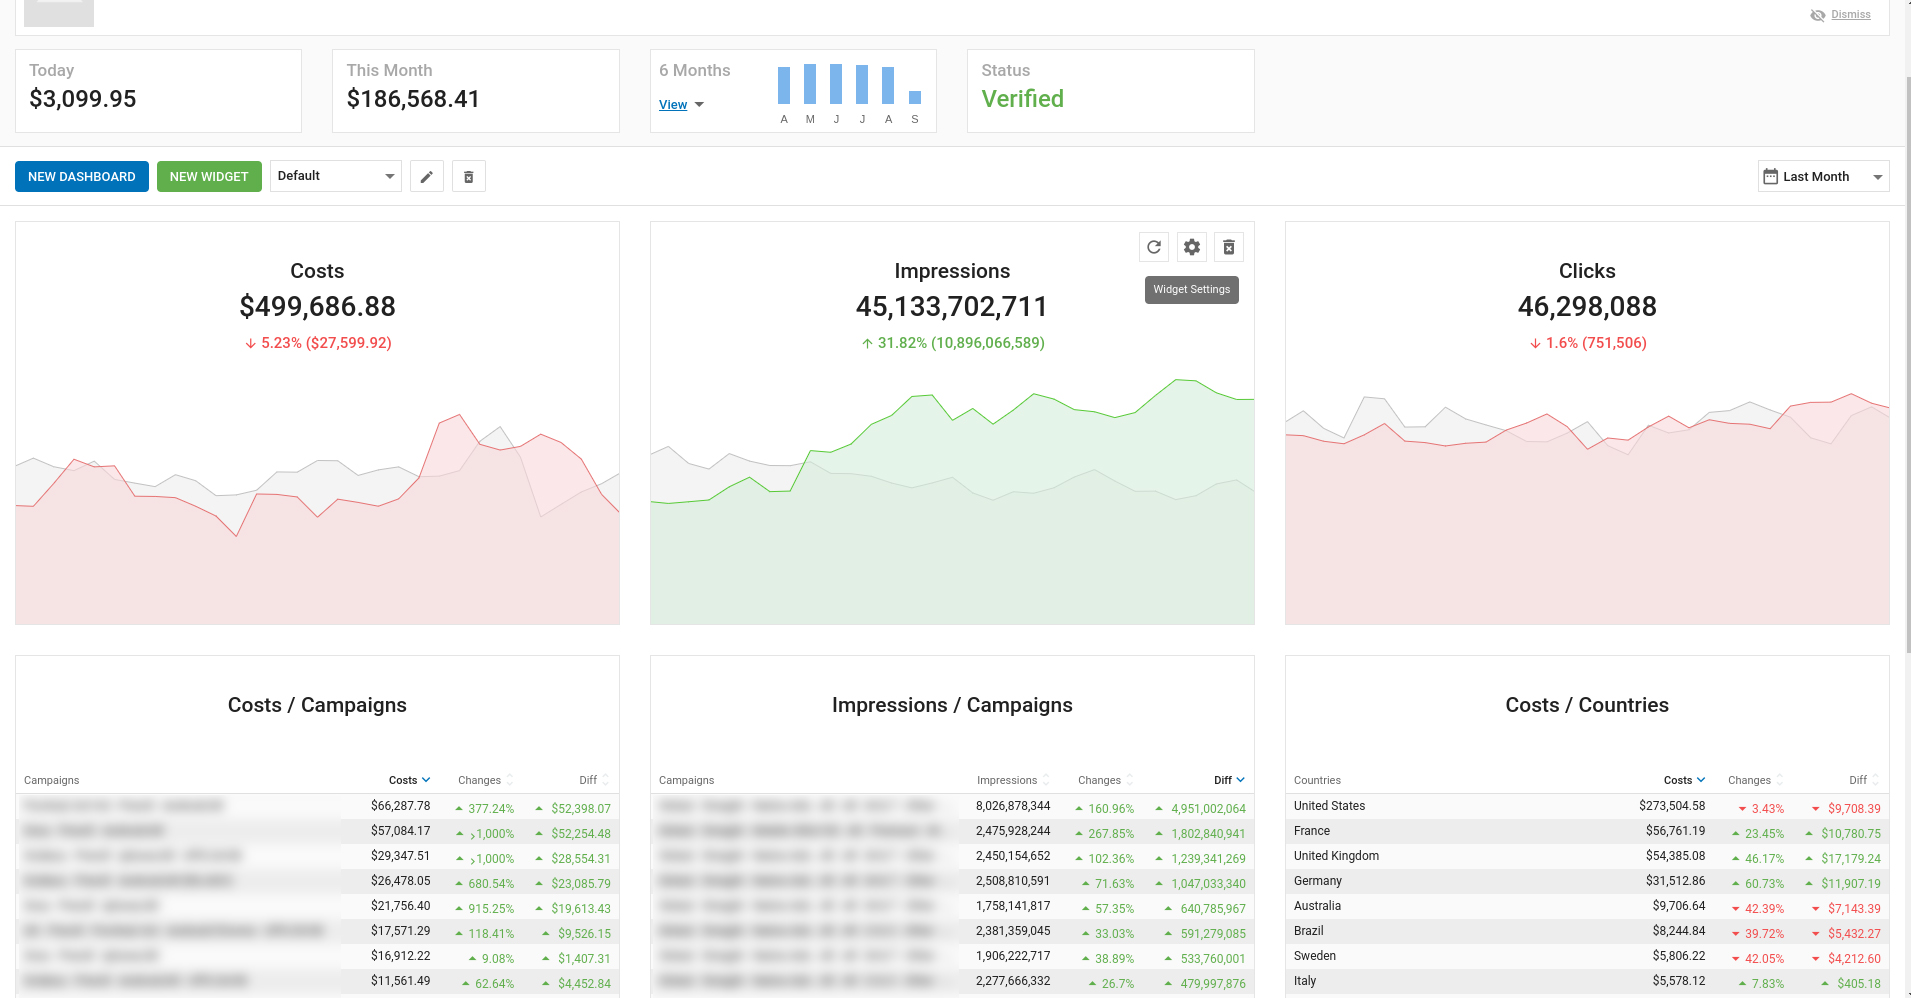
In addition to that, by clicking on ‘Widget Settings’ you can fully customize the widgets through multiple settings and filters options. The following are the 4 ways in which you can analyze campaign data and traffic statistics with ExoClick, by going to ‘Dashboard Tab’:
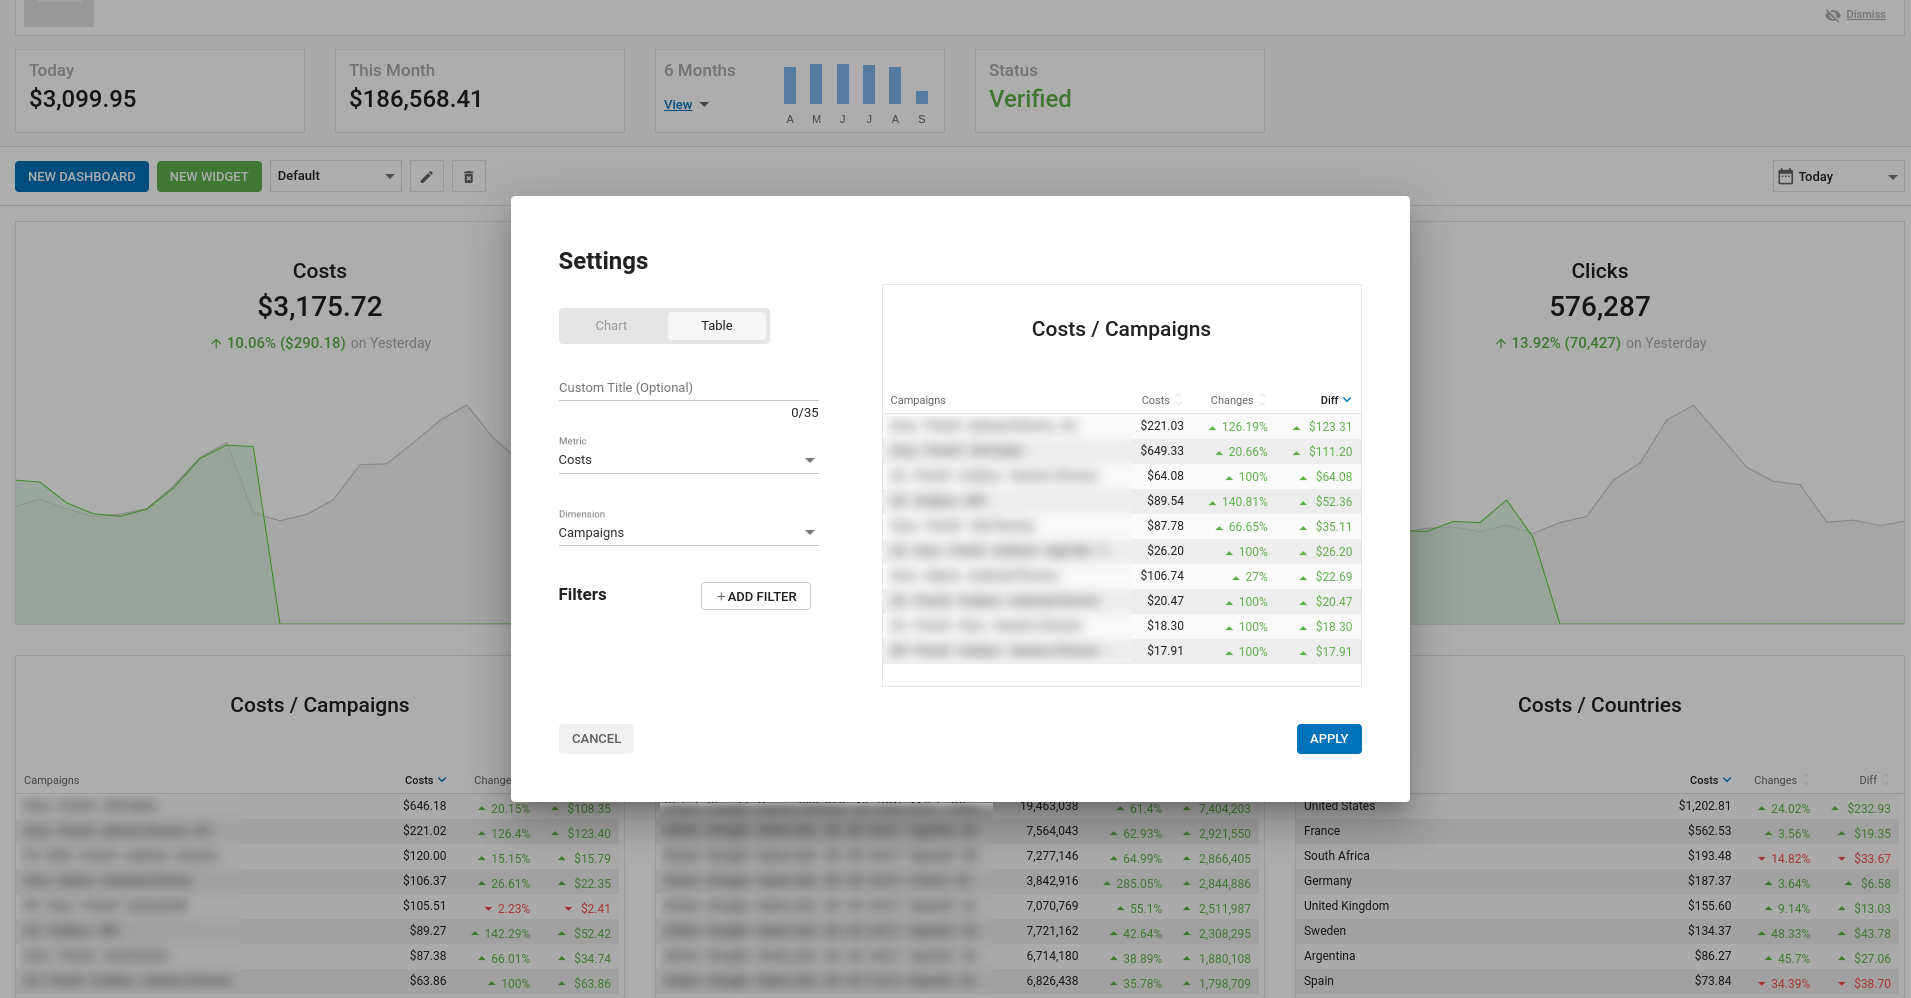
Table Setting: Basically, the presentation of the metrics and numbers in a table within rows and columns.
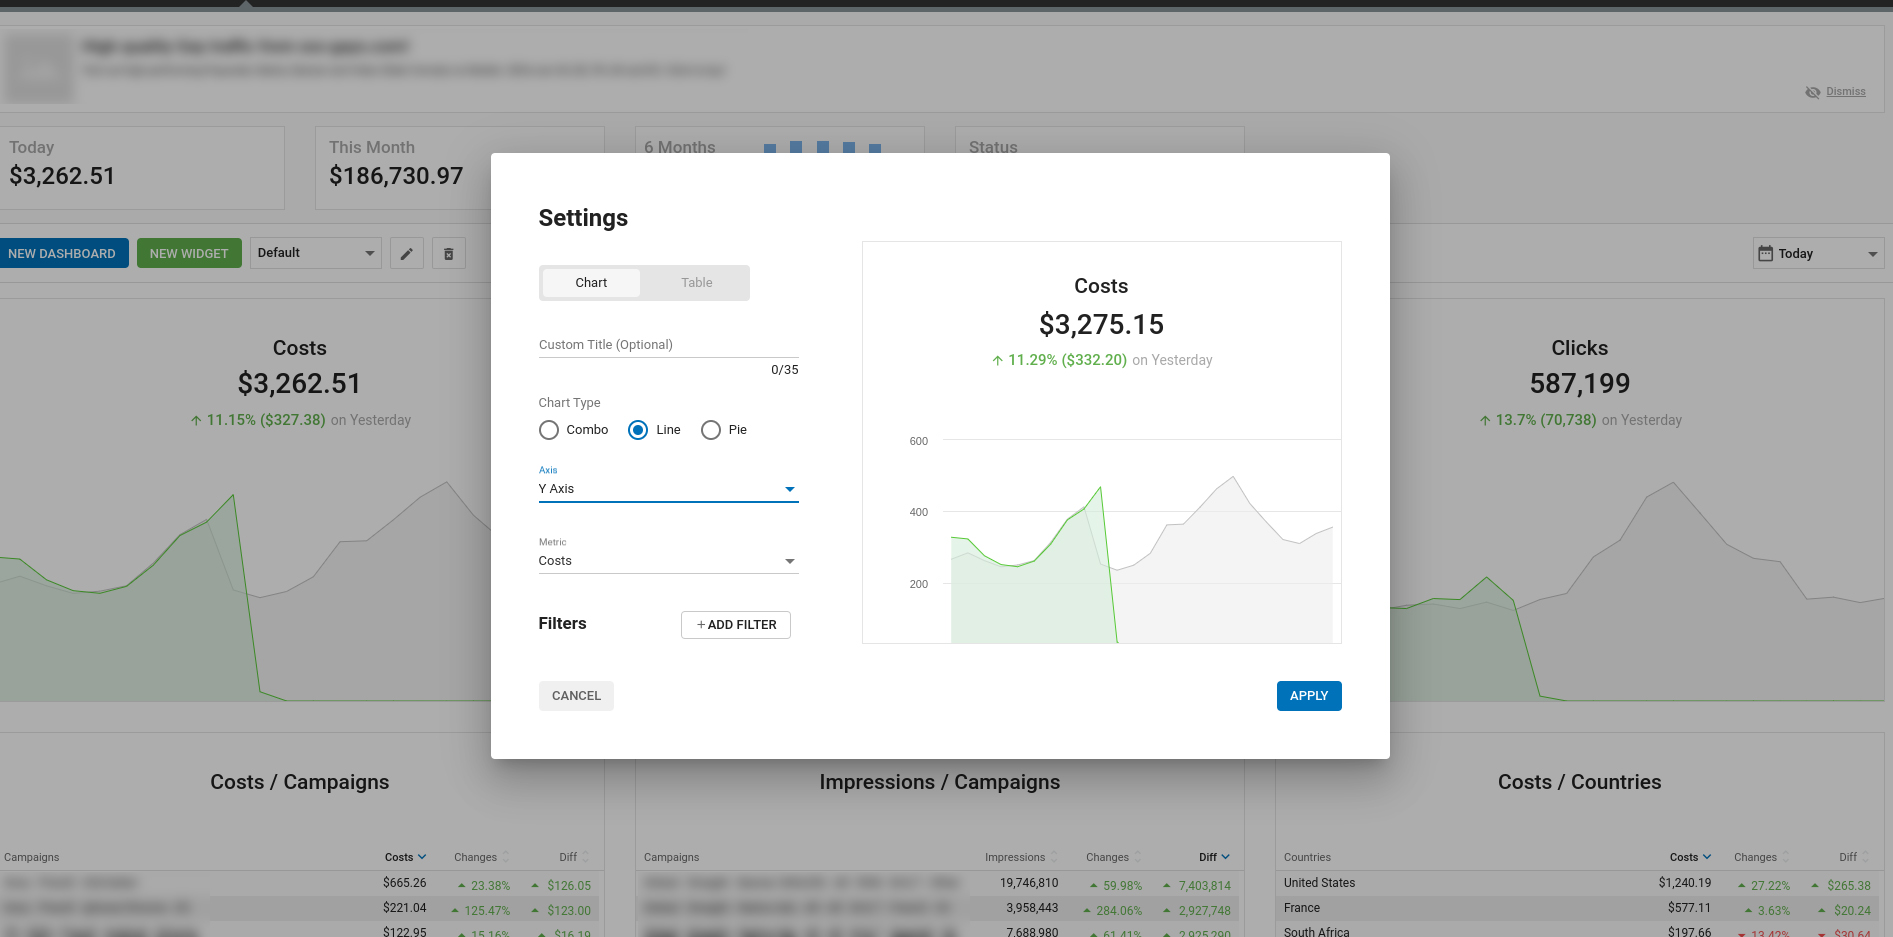
Line Chart: Select in Settings ‘Chart’ and introduce a custom title. Then mark ‘Line’ as your Chart Type and select ‘Axis’ and ‘Metric’ based on your preferences. After this, you can add filters if you need – Here are some of the filters you can use: Countries, Ad Format, Browsers, Devices, Domains, Landing Pages, Carriers, Languages, Sub IDs, Campaign Status, Zone IDs, etc.
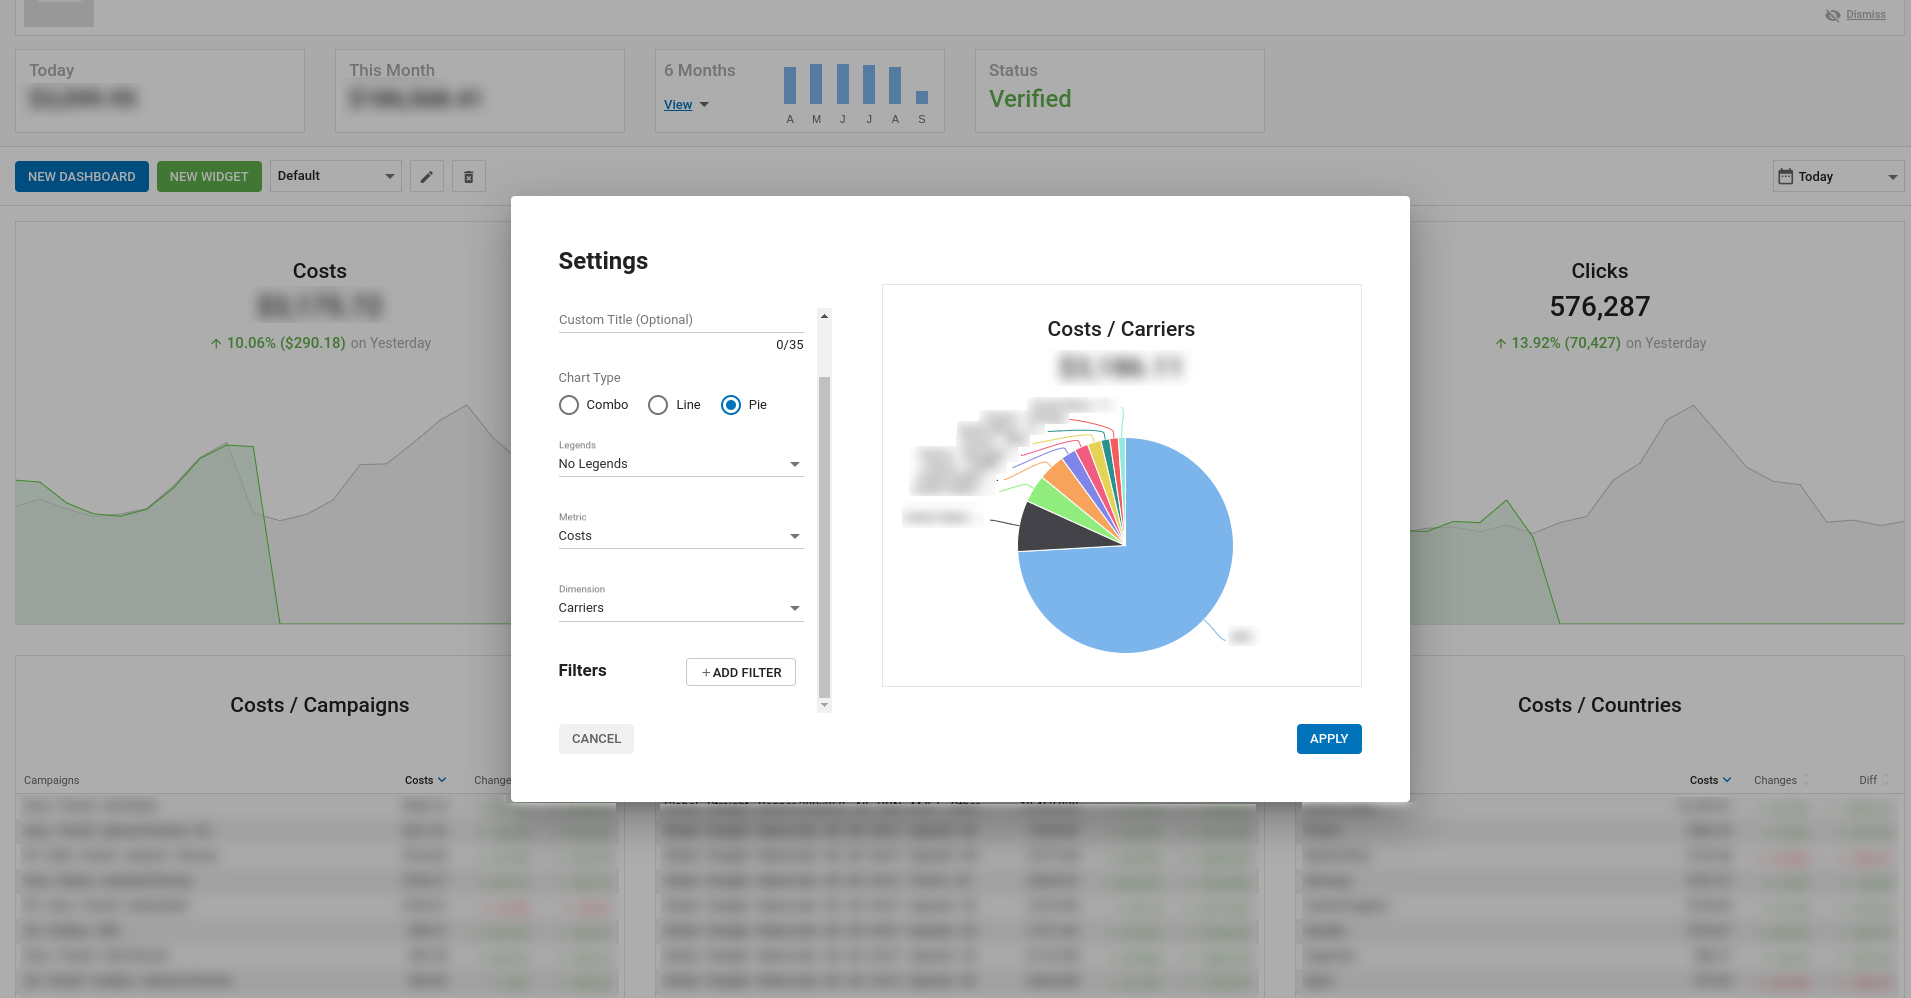
Pie Chart: Select the ‘Chart’ setting and introduce a custom title. Then mark ‘Pie’ as your ‘Chart Type’ and select ‘Axis’ and ‘Metric’ based on your preferences. Once again, you can also add the relevant filters to analyze campaign performance and traffic statistics correctly.
Combo Chart: This is a combination of a ‘Line’ and ‘Bar Chart’. This feature allows Advertisers and Publishers to compare two metrics simultaneously, to get more insights into their data and highlight the most relevant metrics.
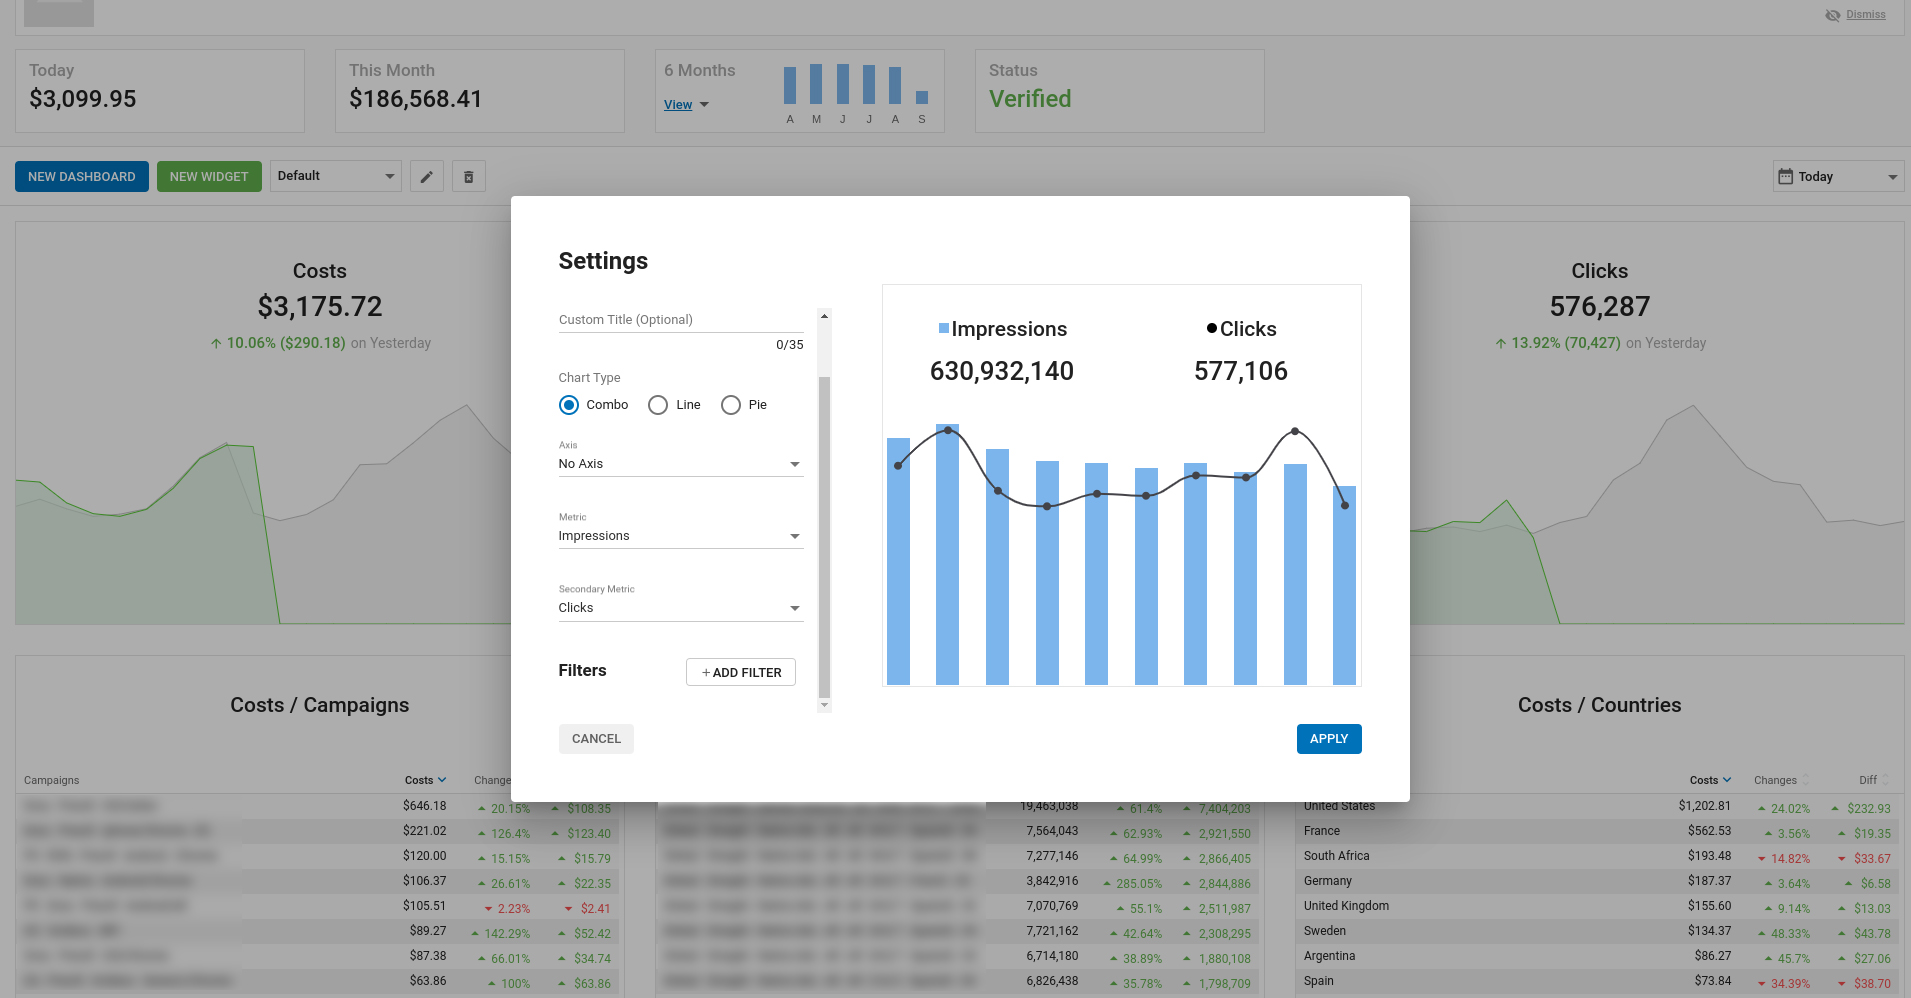
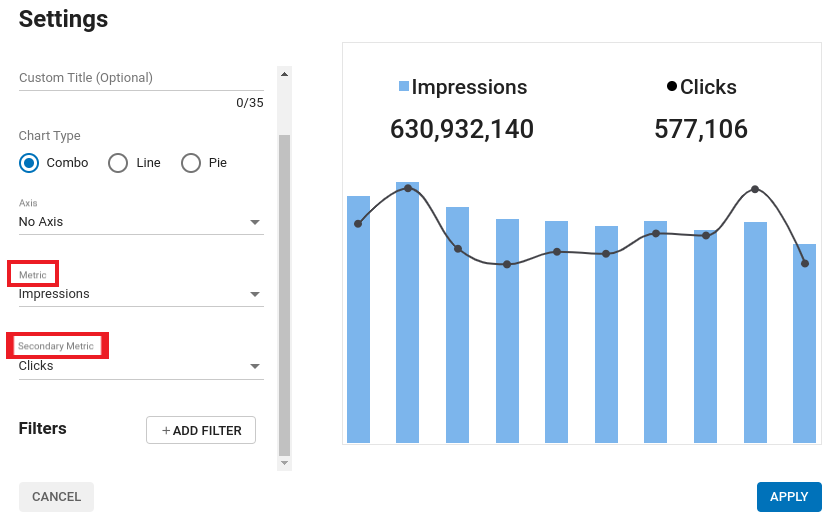
So, as an example, as you can see below, the ‘Primary Metric’ will display the cumulative metrics such as ‘Clicks’, ‘Costs’, ‘Revenue’, ‘Impressions’, ‘Video Impressions’, etc. The ‘Secondary Metric’ will display metrics that are not cumulative, like ‘CPC’, ‘CPM’, ‘CTR’, etc. If you want to learn more ‘Widget Settings’ read this page of ExoClick’s documentation.
Same way you can create different dashboards, you can also remove them as you wish, so if the dashboard is no longer useful, you can easily delete it. For example this could be the case of specific campaigns where Advertisers need more detailed campaign data to measure their performance. As a result when the campaign is paused, the Advertiser can remove it from the dashboard so they can only analyze the campaign data from active campaigns.
How to customize your dashboards with ExoClick
You can customize your dashboards with ExoClick from your ‘Admin Panel’ very easily, in a simple and flexible way, allowing you to focus on the numbers and have fun with the data. Because we know that creating and adjusting widgets and new dashboards can sometimes be slightly complicated, especially when multiple ad zones or campaigns need tracking, at ExoClick we ensure we make these processes simple yet effective, using our innovative tools.
Adding a new dashboard is as simple as going to the ‘Dashboard Tab’, clicking on the icon ‘New Dashboard’ and a new dashboard will be created. You now can start customizing it with the data you want! Note that the maximum number of widgets in any dashboard is 9 and the maximum size of an expanded widget is 2×2. While resizing or dragging and dropping a widget the neighboring widgets will automatically adjust to the next available space.
Statistics tab and filters: ExoClick’s Custom Dashboards
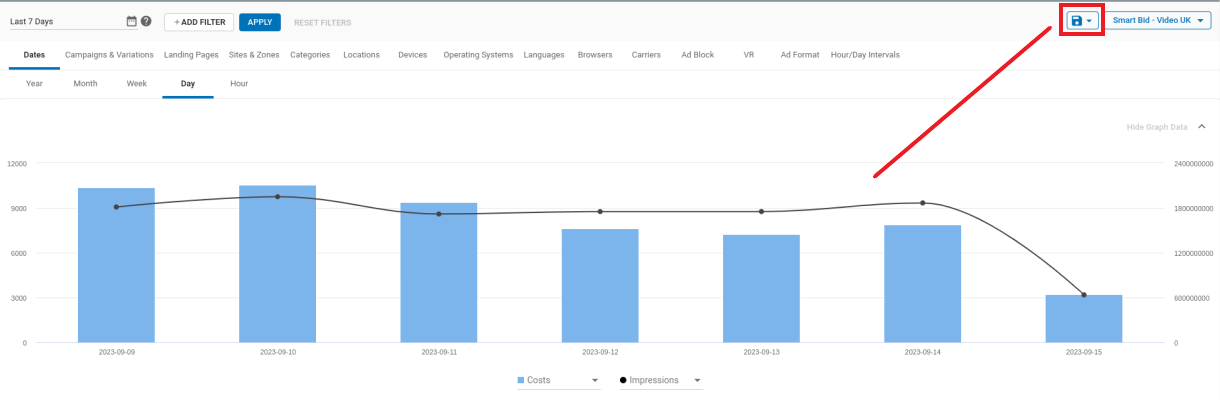
Statistics tab: The Statistics tab shows you a wide range of information about the performance of your websites and ad zones. The information in the Statistics tab is broken down across several tabs: Dates, Sites & Zones, Categories, Locations, Devices, OS, Languages, Browsers, Carriers, Sub IDs, Ad Block, VR, Zone Type, and Ad Exchange.
![]()
Establish the period of time: You can change the ‘Time Period’ of your data. The statistics show the ‘Last 7 Days’ by default, however you can choose a different period by clicking on the calendar icon to the left of the ‘+Add Filter’ button.

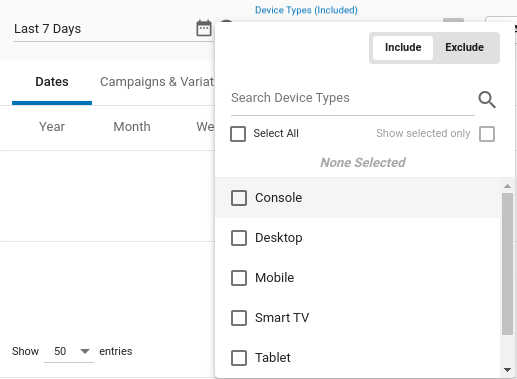
Add filter settings: You can either ‘Include’ or ‘Exclude’ filters, so when you choose to include a filter, you will limit the data to only show the segments that match the filter conditions. For instance, if you choose to ‘Include’ Chrome Browser and Android OS, then you will only see the traffic that belongs to that specific browser and OS. On the other hand, if you choose to ‘Exclude’ a filter, you will remove any data that matches any of the conditions you specify. For example, if you choose to ‘Exclude’ Chrome Browser and Android OS, then you won’t see any traffic coming from that Browser or from that OS.
Saving a Custom Filter: Using the ‘Save Report’ option, you can save a specific set of filters on the statistics page, give this filter set a custom name, and choose from a list of previously saved filter sets. The default view of the ‘Statistics tab’ will not have any filters applied and you can either save a filter report or update an existing saved report. For instance you can save a filter report by adding a few filters of your choice or choose from the list of already saved filters to display your desired view. On the other hand, you can update an existing filter report by selecting it, changing the filters and then clicking on the ‘Update’ button.
This statistic option allows Advertisers and Publishers to quickly analyze in detail those metrics that are most relevant. Which means that our clients can create custom reports by choosing their preferred metrics and filters and easily analyze campaigns, websites and ad zones, because all the information is in the same report.
At this point we have seen how to visualize the data from a Publisher or Advertiser perspective on ExoClick’s Admin Panel as well as the different types of Charts, Filter Settings, and Statistics and we also provided a brief outline of how to create new dashboards and widgets. To follow we will explain in more detail how to customize dashboards and the benefits that they offer to both Publishers and Advertisers.
4 top benefits of building custom dashboards with ExoClick
In your Admin Panel you have access to innovative dashboard features, and continuous tweaking with which you can organize, present and analyze your data and organize it in a highly efficient and functional way. Also, you can work in a way that best suits your analytics needs and collect more data relevant to your business. The following is a list of the top benefits of building custom dashboards with ExoClick and what you can expect from dashboard customization settings, whether you are an Advertiser or a Publisher:
Benefit 1! Track & analyze the right data: We allow you to skip less relevant data so you make sure that the collected data offers you the most useful insights to point you in the right direction.
Benefit 2! Improve your decision making: Your dashboard gives you all the top-level information and quick answers you need to improve your decision making process. By simply clicking on the ‘Save Report’ button, you can investigate a large number of metrics instantly and take the optimal action.
Benefit 3! Get a full view of your performance: With ExoClick, you can create multiple dashboards with a customized view, with as many widgets per dashboard as you need. This allows you to know which pages, feeds, GEOs, devices, browsers, etc. have the best numbers and the highest ROI.
Benefit 4! Make the most out of your data: If you find that you are spending too much time pulling your reports together each month, use the ‘Save Report’ option on your list once you have worked out which metrics you want to fetch and focus on. This will allow you to free up time to spend on other important tasks and not worry about missing out on the critical metrics insights that you need.
ExoClick Admin Panel: Publisher overview for customized dashboards
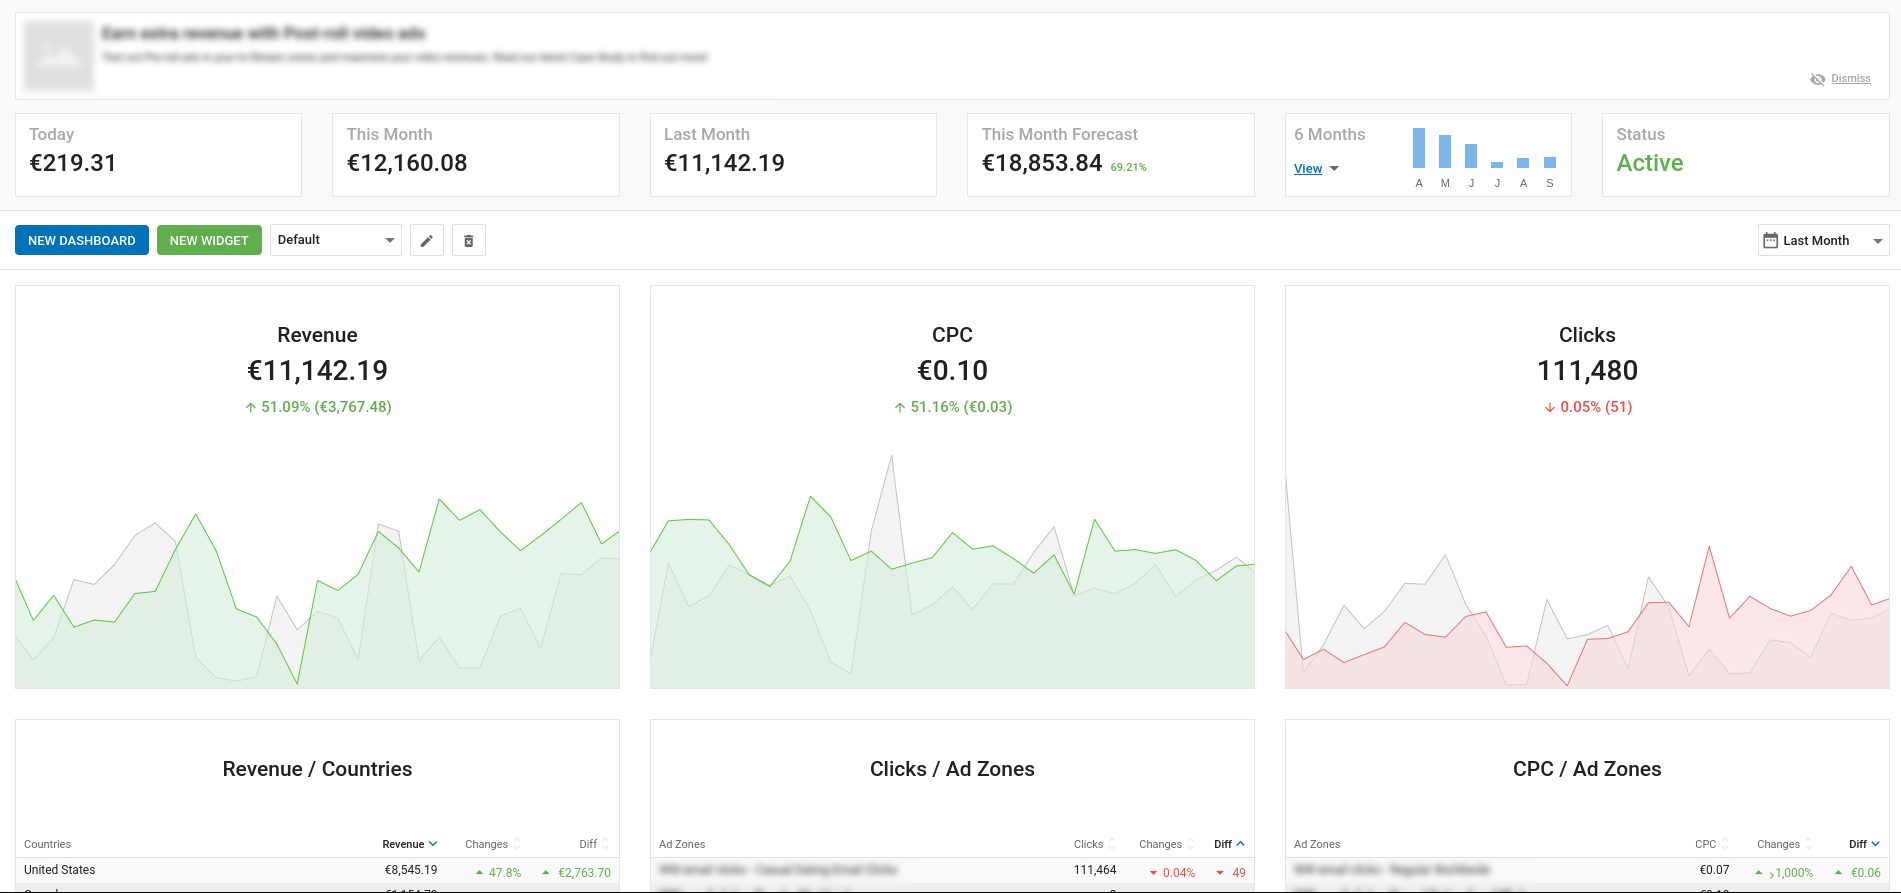
Here we have an example of a Publisher view where we can see which widgets, metrics and dimensions are the most relevant data for this specific Publisher. So when the Publisher logs into the account and the ‘Dashboard tab’ is shown, they have all the relevant information they need to help analyze ad zones and traffic statistics to increase their business performance.
ExoClick Admin Panel: Advertiser overview for customized dashboards
Here we have an example of a basic Advertiser overview where they adjusted the widgets and metrics that are most relevant in the ‘Dashboard Tab’. Tracking, testing and analyzing the campaigns is a tough job as it requires a lot of time and effort. But with customizable dashboards Advertisers can analyze the campaign performance in real time and in a matter of seconds.
Conclusions
Using ExoClick’s customizable dashboards allows you to display only the data and metrics most relevant to your business, helping you to focus on the key metrics and other crucial business indicators. This means that ExoClick’s custom dashboards empower you to better manage your key data and make better decisions. Want to learn more about how to use ExoClick’s customizable dashboards? Contact your account manager or get in touch with our Customer Success team.