5 ExoClick Network Stats from 2018

Our Business Intelligence team have been looking through all the data generated on our network throughout 2018 to bring you some fascinating traffic insights.
1. NETWORK WEBSITES
The total number of publisher websites on ExoClick’s network during 2018 was 135,778 and we served over 6 billion daily ad impressions. Based on impressions served and number of websites, we compared what the average impressions and clicks per site were for 2017 & 2018:
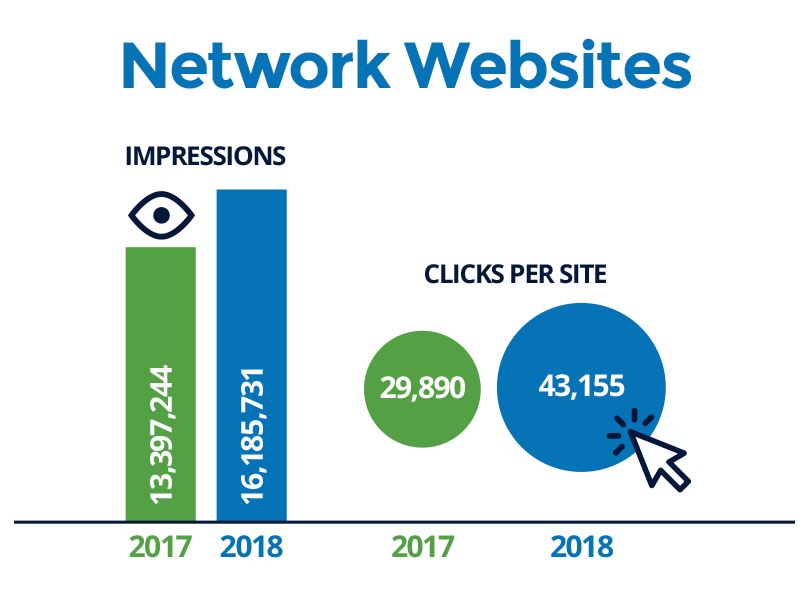
That is an average of 20.81% increase of impressions and 44.37% more clicks per site!
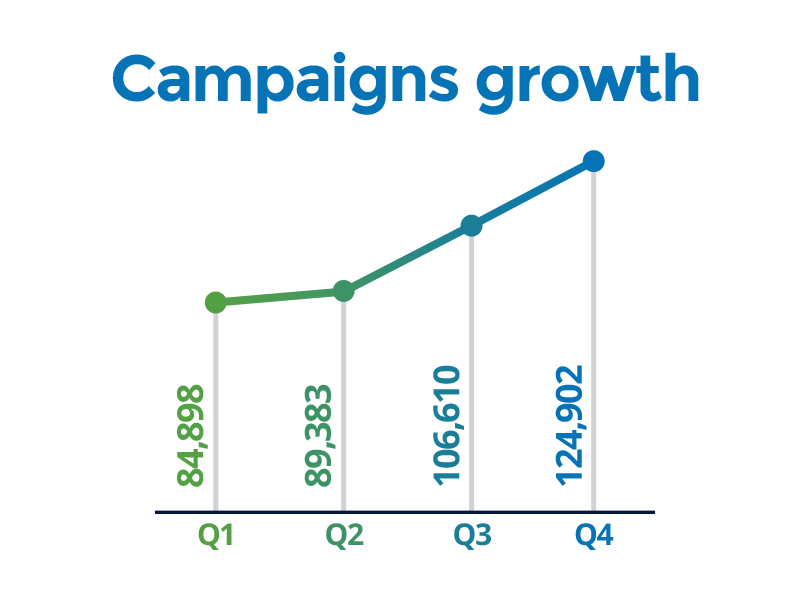
2. CAMPAIGNS GROWTH
Total number of campaigns per quarter run on ExoClick’s network during 2018 were:
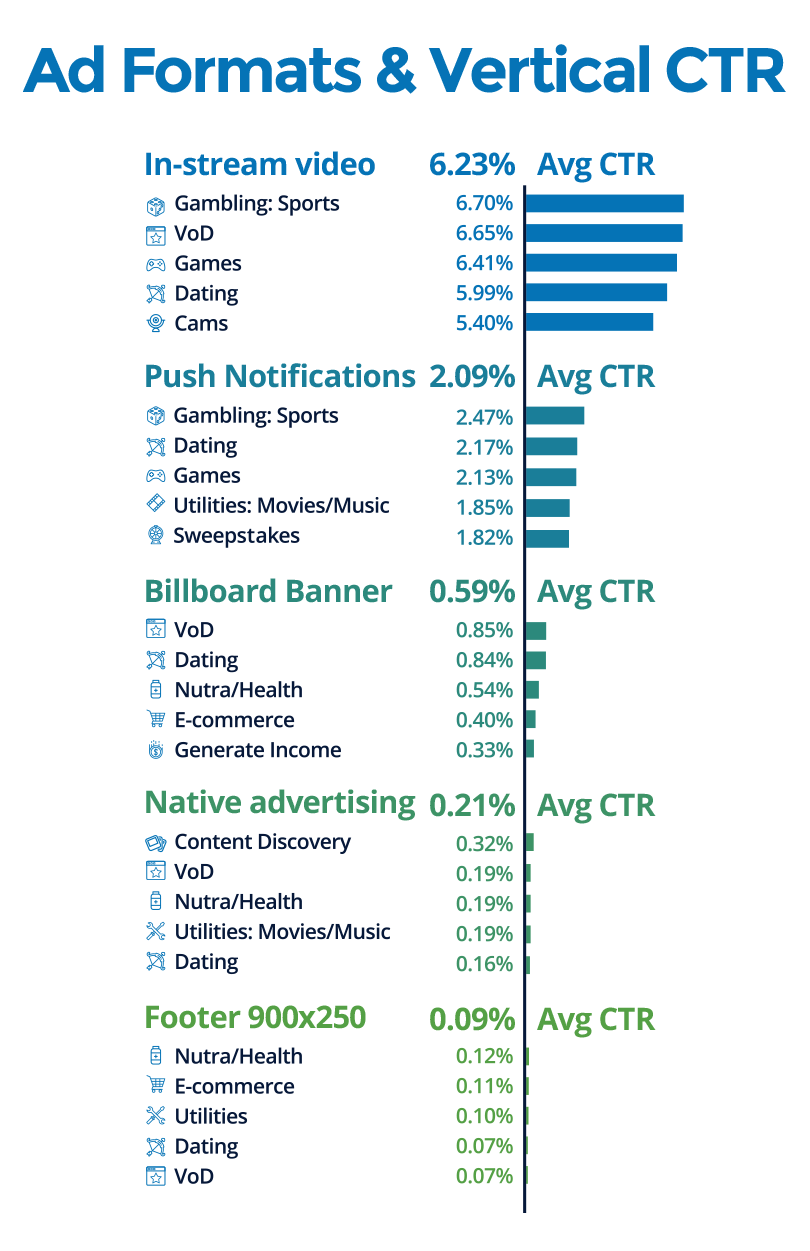
3. AD FORMATS & VERTICAL CTR
We looked at a selection of our ad formats across all websites and GEOs on our network, then we examined the impressions served versus end user clicks. This was to tell us what the average CTR was for the Top 5 converting verticals for each ad format.
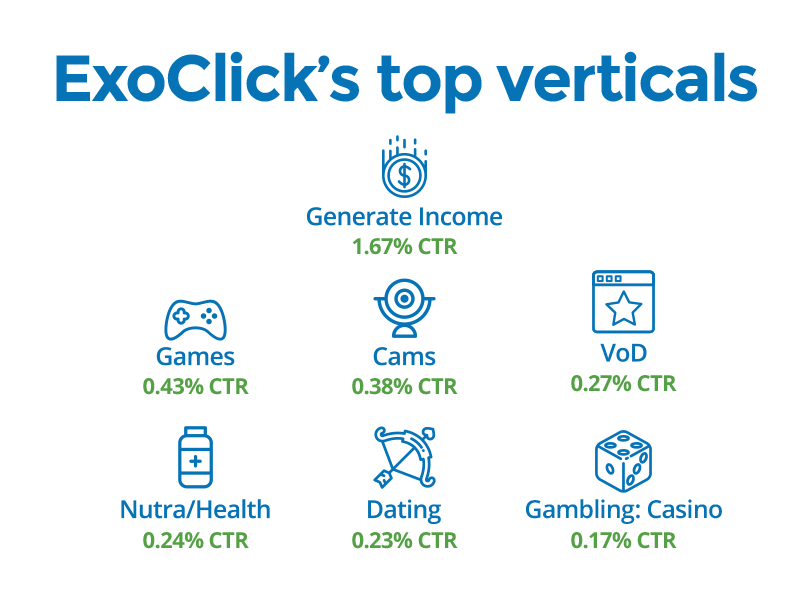
Then we looked at the average CTR for the top 7 most popular verticals across all of ExoClick’s +20 ad formats:
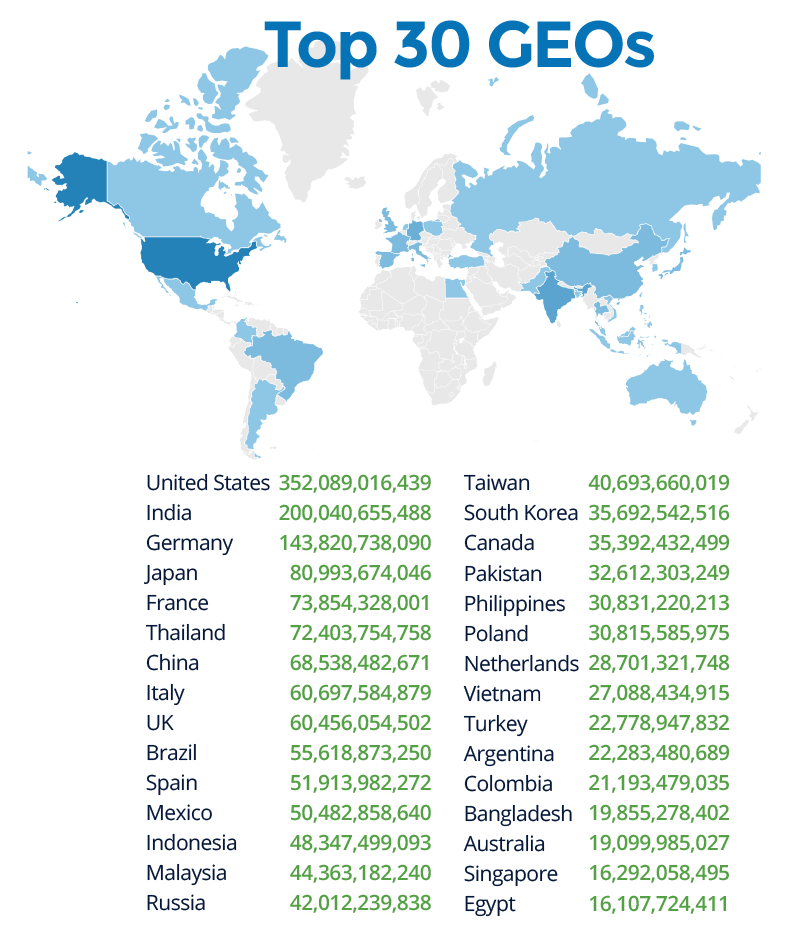
4. TOP 30 GEOS
Here are the top 30 GEOs serving the largest impressions:
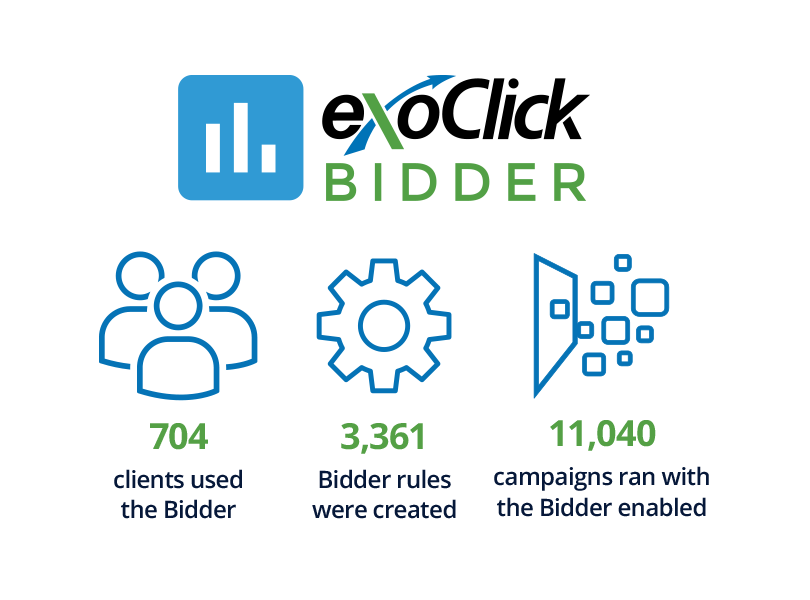
5. THE EXOCLICK BIDDER
The ExoClick Bidder was one of the innovations we introduced in the third quarter of 2018. The new tool enables advertisers to automate bidding and blocking of non-performing ad zones using rules set by the advertiser. Here are some interesting statistics:
We hope that these insights provide you with some facts to help you make the right decisions when targeting your offers to potential customers.