7 ExoClick network statistics for Q1 2018

ExoClick’s Business Intelligence department has been busy crunching numbers and we have some interesting traffic insights for Q1 2018. The focus of these statistics are ExoClick’s Native advertising and In-stream video ad formats.
Native advertising statistics Q1 2018
1.The top 5 GEOs serving Native impressions were:
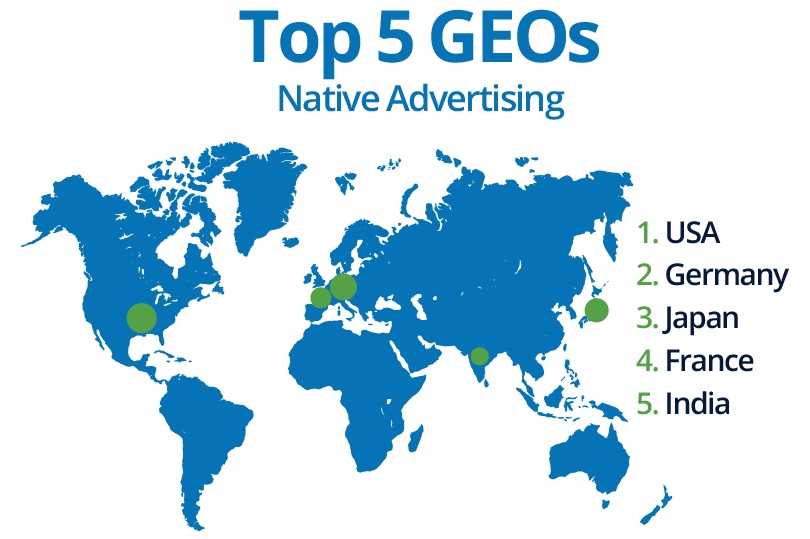
In fact the USA is the biggest market for Native ads with predictions from eMarketer stating that this year 58.3% of US digital display spending will be for Native placements, that’s up from 54% in 2017.
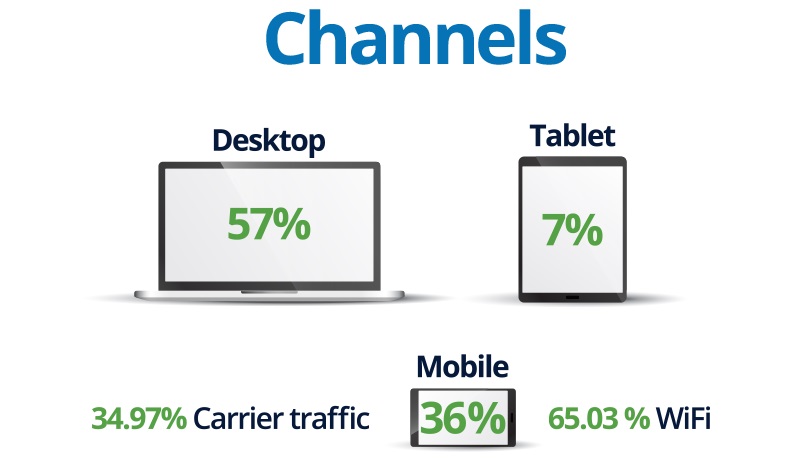
2. Devices serving Native ads
During Q1 desktop was leading the way and we served 57% of our Native impressions on that device, 36% on mobile and 7% on tablets. Of the mobile impressions 34.97% were from carrier traffic and 65.03% from wifi.
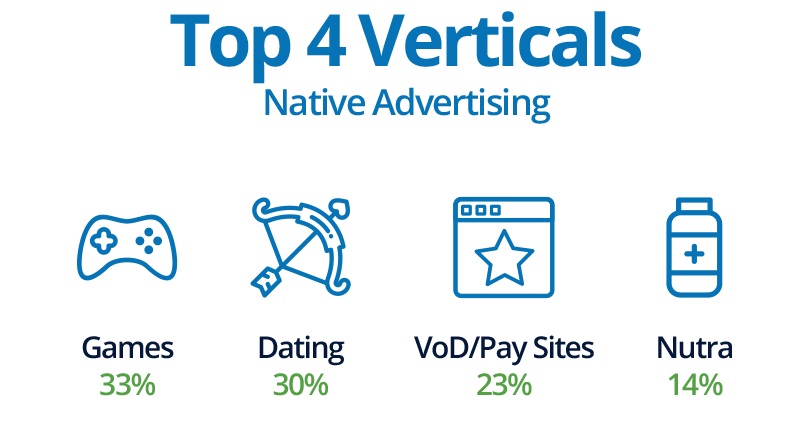
3. Top 4 verticals for Native ads
So what verticals were advertisers and affiliates pushing with their offers for this format in Q1? The percentages of the top 4 performing verticals used for Native advertising were Games 33%, Dating 30%, VoD/Membership Sites 23% and Nutra products 14%.
Of course Native ads are all about creating compelling content to drive clicks. Performance-based native advertising platform Outbrain selected the best Native ad campaigns of 2017, check them out here for some inspiration for your next campaign.
In-stream video statistics Q1 2018
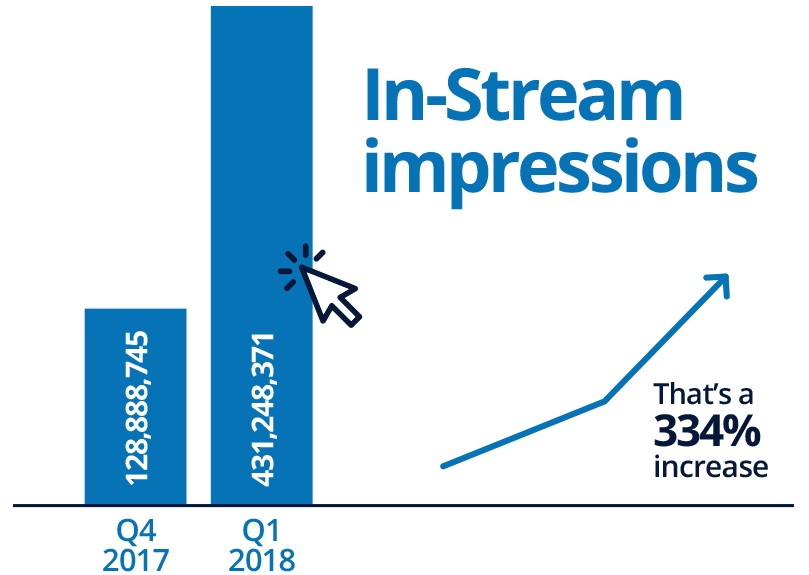
4. In-stream growth
ExoClick saw a massive increase with in-stream video ads, in fact compared to Q4 of 2017, Q1 of 2018 has seen an in-stream video ad impressions growth of 334% to 431,248,371 impressions.
ExoClick’s offers pre, mid and post roll in-stream video ad formats. Pre-roll is by far the most popular in-stream format in Europe according to online market research company Statista. They have evaluated in-stream video advertising formats used in Europe during 2017 by device, which you can see here.
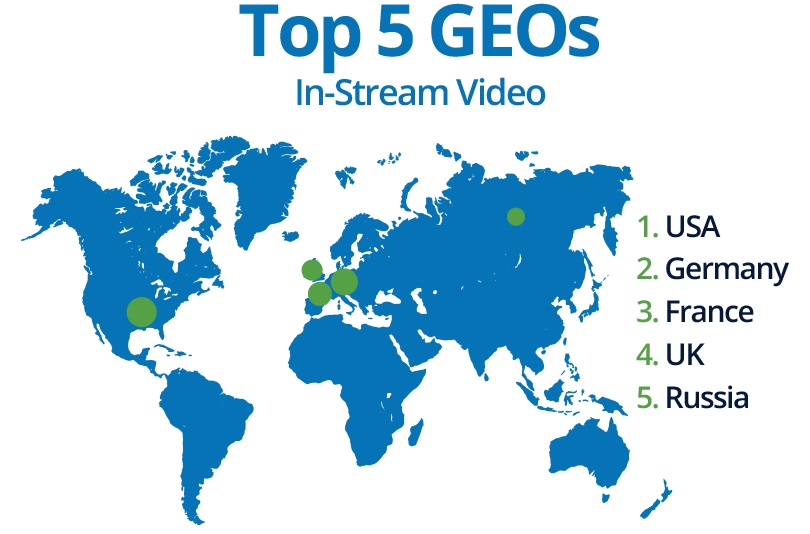
5. The top 5 GEOs serving in-stream impressions were:
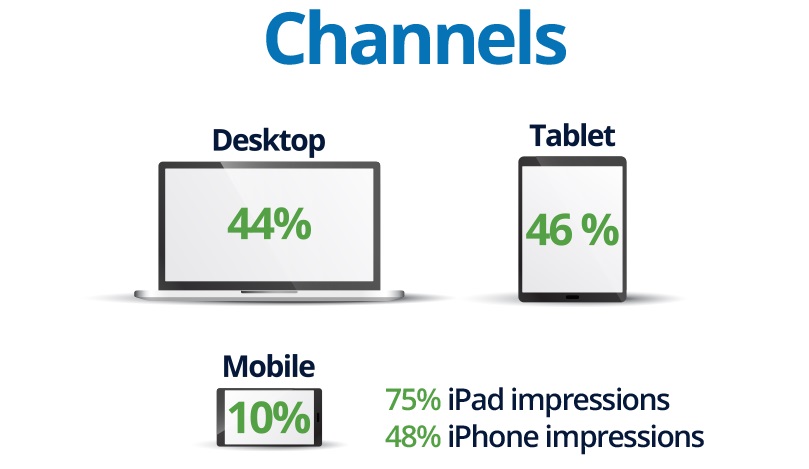
6. Devices serving In-stream ads
44% of in-stream impressions are served on desktop, 46% on mobile and 10% on tablets. Interestingly 75% of tablet impressions were on the iPad, with tablets being used mainly to watch video content, it seems advertisers are targeting what are considered to be the more affluent Apple users. On the smartphone side, iPhone impressions showed 48% of mobile impressions for in-stream with 52% on Android.
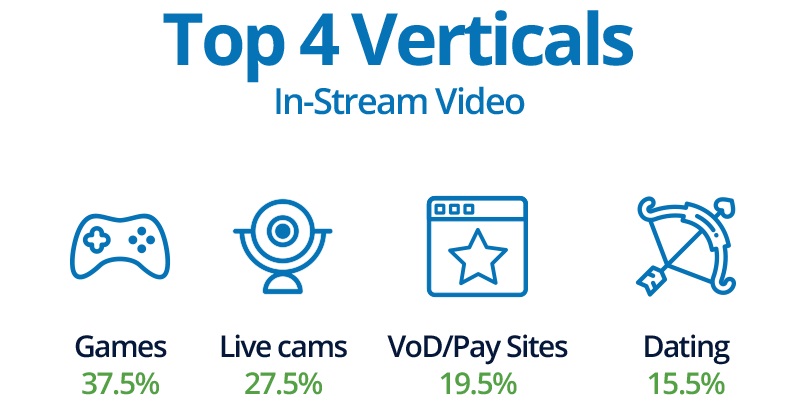
7. Top 4 verticals for in-stream ads
On ExoClick’s network, Games were the leading vertical for this ad format:
If you would like even more industry statistics about video marketing, Wordstream has collected together 37 of them taken from various sources, which you can see here.