7 Network Statistics Q3: Global RTB and Native Advertising on RTB
In our regular quarterly network statistics blog post, ExoClick’s Business Intelligence department has been busy crunching numbers to reveal interesting traffic insights for Q3 2018. The focus of this quarter’s statistics is RTB and Native advertising on RTB.
Global RTB statistics
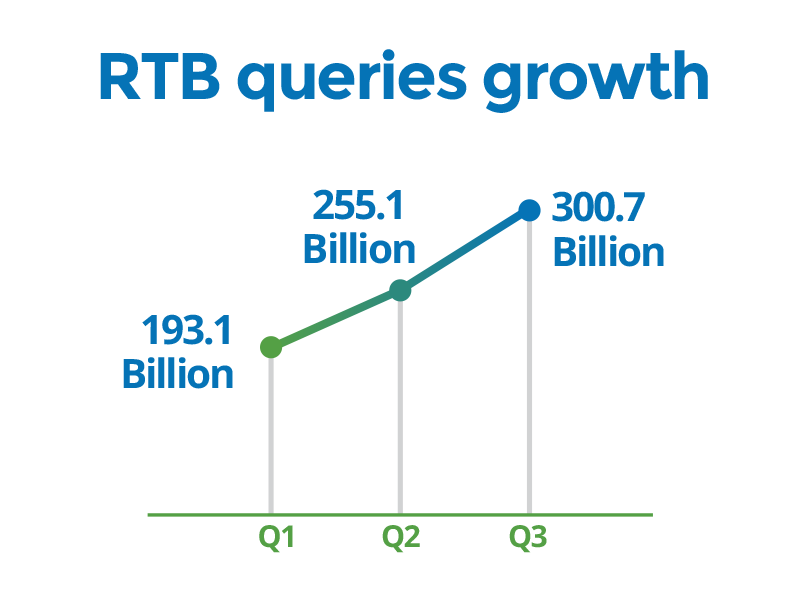
1. Global RTB growth
ExoClick has seen impressive growth over the last 3 quarters with its RTB business, here you can see the number of queries (bids) we have processed:
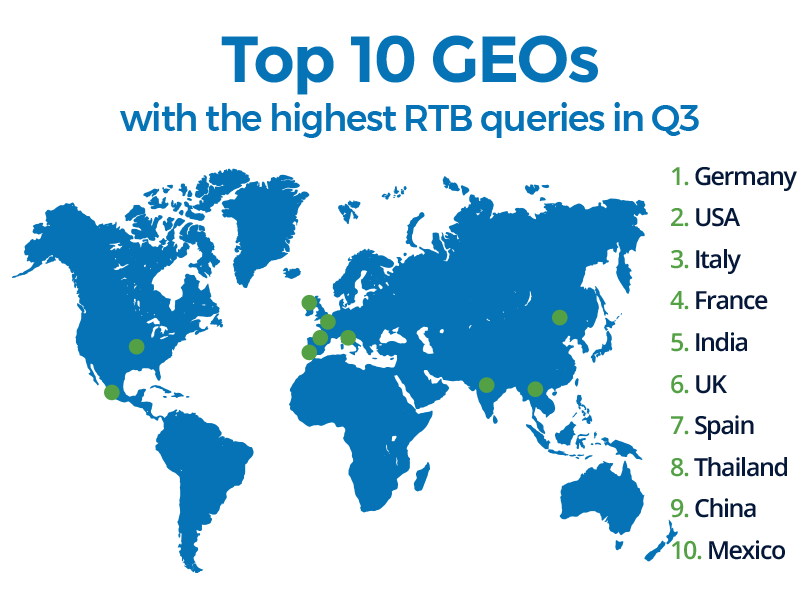
2. Top 10 RTB GEOs Q3
ExoClick processes RTB queries in 262 countries, here are the 10 GEOs where we have processed the most queries:
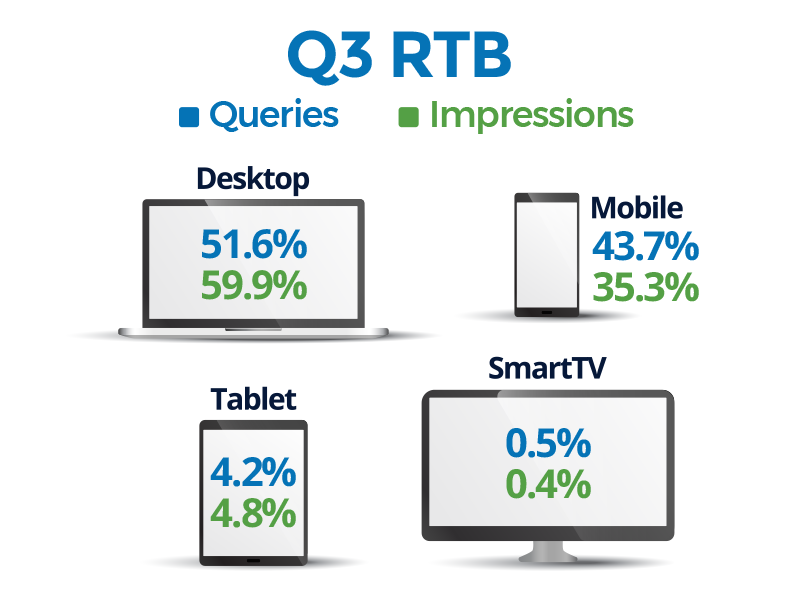
3. Device split RTB
Here you can see the device split of RTB queries and RTB impressions served:
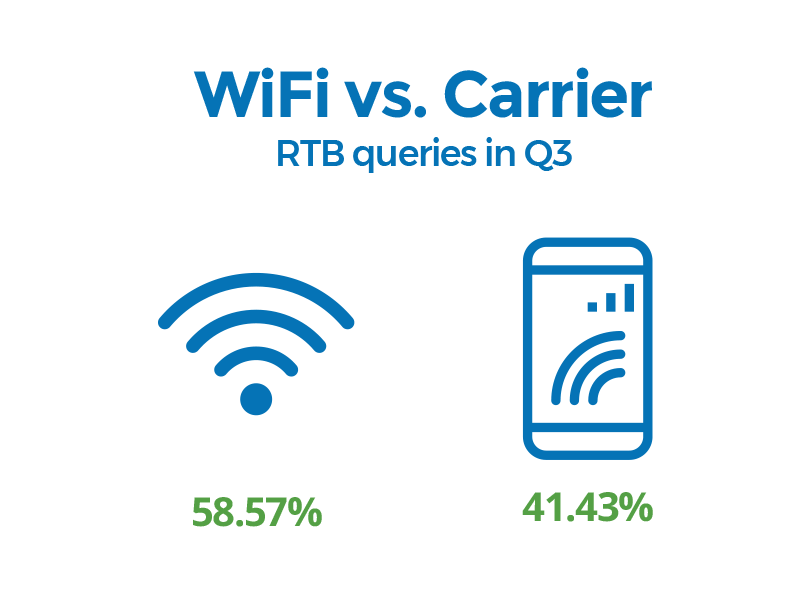
4. WiFi versus Carrier RTB queries
On mobile, here is the WiFi/Carrier split of queries in Q3:
Native RTB statistics
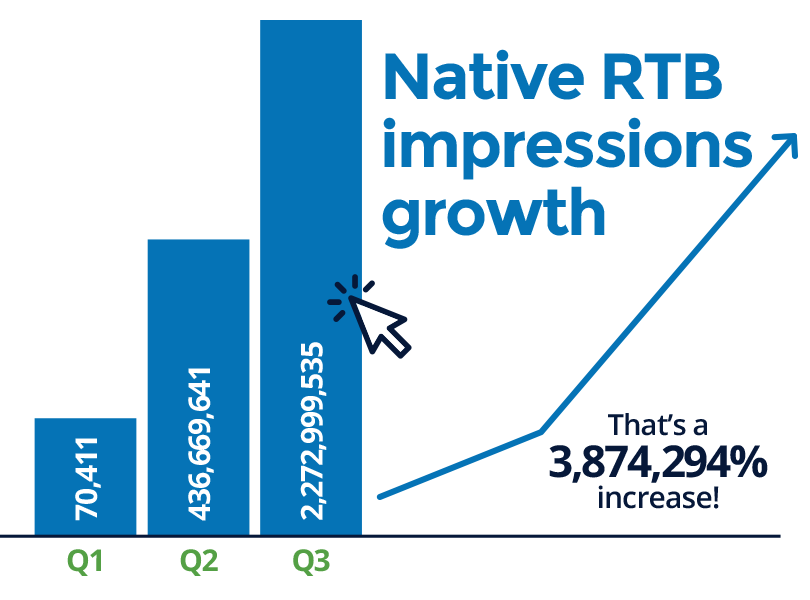
5. Native RTB impressions growth
Native ad impressions on RTB have grown exponentially. We introduced the ad format to RTB in Q1, see how the impressions have grown:
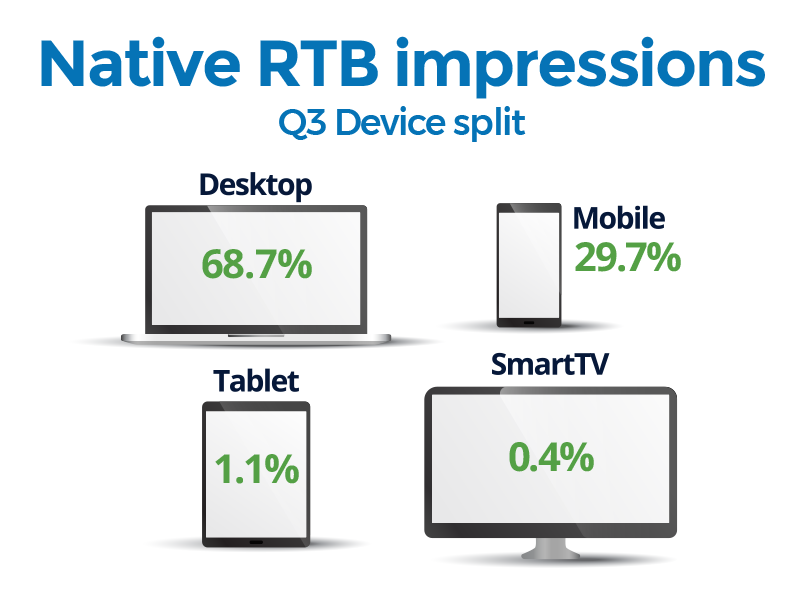
6. Native RTB device split
In Q3 Native RTB impressions we still served the highest via Desktop, followed by Mobile, Tablets and finally SmartTV:
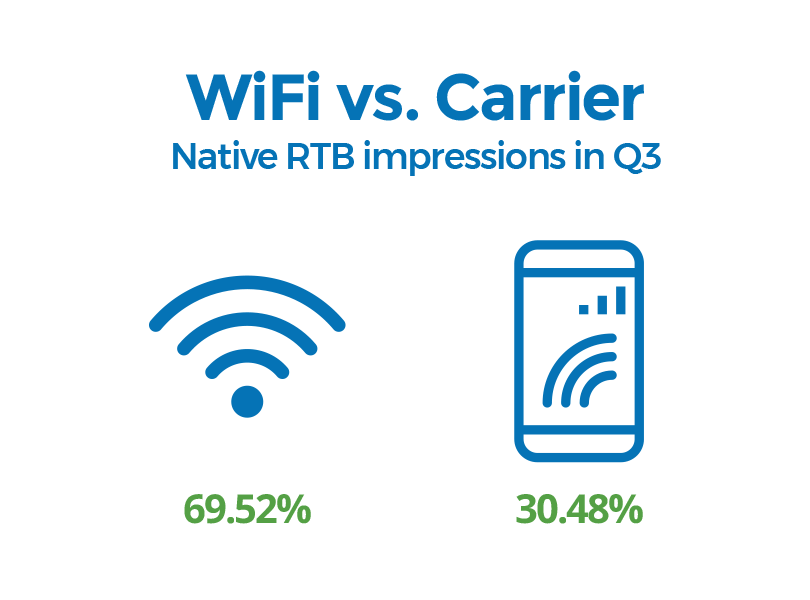
7. WiFi versus Carrier Native RTB impressions
Looking at mobile in more detail, here you can see how many Native RTB impressions were served via Carrier and WiFi in Q3: